For any business owner in the Monterey Bay Area—whether you're in the ag-tech heart of Salinas or run a shop in Carmel-by-the-Sea—every marketing dollar has a job. The question is, can you confidently say where that money is going and what it's bringing back? This is where a marketing performance dashboard cuts through the noise. Think of it as your command center, pulling the most important data from all your marketing channels into one clear, visual report.
What is a Marketing Performance Dashboard, Really?
Let's get practical. A marketing performance dashboard is the central nervous system for your digital strategy. It’s a custom-built interface that displays your Key Performance Indicators (KPIs) — the metrics that truly matter — from platforms like Google, Facebook, and your website, all in one place. For a busy contractor managing jobs across Santa Cruz County, this isn't a luxury; it's a strategic necessity.
You can stop logging into five different accounts just to check ad spend, website traffic, and lead counts. Instead, you get a single, clear snapshot. This unified view helps you finally connect your marketing activities to what really matters: phone calls, form fills, and booked jobs.
Why Gut Feelings Aren't Enough for Our Local Market
Relying on instinct to guide your marketing budget is like navigating the Monterey Bay fog without a compass. You’re moving, but are you heading toward your goal? A dashboard replaces that guesswork with hard data.
A well-built dashboard doesn't just show you numbers; it tells a story. It answers critical questions like, "Did that ad campaign in Hollister actually bring in qualified leads, or did we just pay for a bunch of empty clicks?"
This data-driven approach is fundamental for any local business aiming to grow without wasting money. It turns your marketing budget from an expense into a measurable investment. For home service pros, pairing a solid dashboard with the right strategies is the key to success. You can find more of our thoughts on this in our guide to marketing resources for home service contractors.
The Core Benefits for Your Monterey Bay Business
Implementing a dashboard brings immediate clarity and sets you up for long-term wins. Here’s what you can realistically expect:
- Saves Precious Time: Stop wasting hours pulling numbers and building reports by hand. A dashboard automates data collection, giving you more time to actually run your business.
- Improves Decision-Making: With clear, real-time data, you can make faster, more confident calls. You'll know exactly which campaigns are working and deserve more budget, and which ones need to be paused.
- Demonstrates Clear ROI: This is the big one. You can finally draw a straight line from what you spend on marketing to the revenue it generates. A dashboard visualizes your Return On Investment (ROI), making it easy to justify your marketing efforts and plan for future growth.
This guide will walk you through the practical steps to build a dashboard that gives you solid answers and a serious competitive edge in our unique coastal economy.
Laying the Groundwork: Goals and Data Sources
Before you build a fancy marketing dashboard, we need to get one thing straight: a pretty chart is worthless if it isn't tracking what puts money in your pocket. You have to define what success really looks like for your business.
For a roofer in Hollister, that might be a flood of calls for emergency leak repairs. For a landscaper over in Gilroy, it’s probably qualified leads coming through their website's contact form. Your goals are unique to your business.
The trick is to nail down your Key Performance Indicators (KPIs). These are the specific, measurable numbers that tell you if your marketing is working. We're not talking about vanity metrics like social media likes; we're talking about the data that directly leads to booked jobs and revenue.

What Are Your Business Goals, Really?
Start with the most fundamental question: "What do I want a potential customer to do?" The answer is the bedrock of your entire dashboard.
Your goals need to be SMART—Specific, Measurable, Achievable, Relevant, and Time-bound. "I want more leads" isn't a goal; it's a wish. A real goal sounds like this: "I want to generate 20 new quote requests through the website each month from homeowners in Monterey County." See the difference?
I’ve seen many local business owners get sidetracked by metrics that don’t matter. The real goal isn't just getting more website traffic; it's getting the right traffic—local customers who are ready to hire you.
Pinpointing Your Data Sources
Once your goals are crystal clear, it's time to figure out where the data lives. For most businesses, your information is scattered across a handful of platforms. Your mission is to round up the login info for every single one to feed your dashboard.
Here’s a practical checklist of the most common data sources:
- Your Website Analytics: This is almost always Google Analytics (GA4). It’s your source of truth for how people find and use your site, tracking everything from page views to goal completions, like form submissions.
- Your Google Business Profile (GBP): For any local business, this is gold. Your Google Business Profile shows how many people found you in local search, clicked for directions, or called you right from the search results.
- Your Ad Platforms: If you're running ads, you need access to your Google Ads or Meta Ads accounts. This is where you find hard numbers on ad spend, cost per click, and how many leads those ads generate.
- Your Call Tracking Software: Using a service like CallRail or CallTrackingMetrics is non-negotiable. It’s the only reliable way to know which marketing channels are making your phone ring.
- Your Email Marketing Tool: If you send newsletters with a tool like Mailchimp, you'll want to pull in data on open rates, click-through rates, and any business that came from those emails.
Getting access is a critical first step. Seriously, don't skip it. Making sure you have the right permissions for each platform is the foundation that makes a unified, insightful dashboard possible. For service pros, connecting these dots is often the first real step toward a stronger online presence, which we dive into deeper in our guide to https://core6.marketing/seo-services-for-landscapers-tree-service-pros/.
Choosing Metrics That Matter for Monterey Bay Businesses
A powerful marketing performance dashboard isn't about cramming every metric onto one screen. It's about a laser-like focus on the numbers that reflect the health of your local business, whether you’re serving clients in the Salinas Valley or across Santa Cruz County.
The real trick is learning to separate actionable insights from distracting vanity metrics. I've seen too many business owners get hung up on numbers that look good but don't actually put money in the bank.
A great way to organize your dashboard is by thinking about the customer's journey. This path has three main stages, and each has specific numbers that tell you if your marketing is working. Let's break down what you need to be watching.
Awareness Metrics: Are Local Customers Finding You?
This first stage is all about getting on your local customer’s radar. The question is simple: when someone in your service area needs what you offer, are you the one they find? To answer that, you need to track metrics that prove your visibility here in the Monterey Bay Area.
Here's what I recommend focusing on:
- Local Search Impressions: This isn't just about total impressions; it's about where they come from. How many times did your business show up for searches like "electrician in Watsonville" or "digital marketing for Santa Cruz retailers"? This shows your real reach in your target markets.
- Google Business Profile (GBP) Views: This is your digital storefront. Tracking views on Google Maps and in local search results is a direct measure of your local visibility. It's one of the first things I check.
- Website Traffic by Source: You need to know which channels are pulling their weight. Is it Organic Search, Google Ads, or a local Facebook group that's driving people to your site? This tells you where to double down.
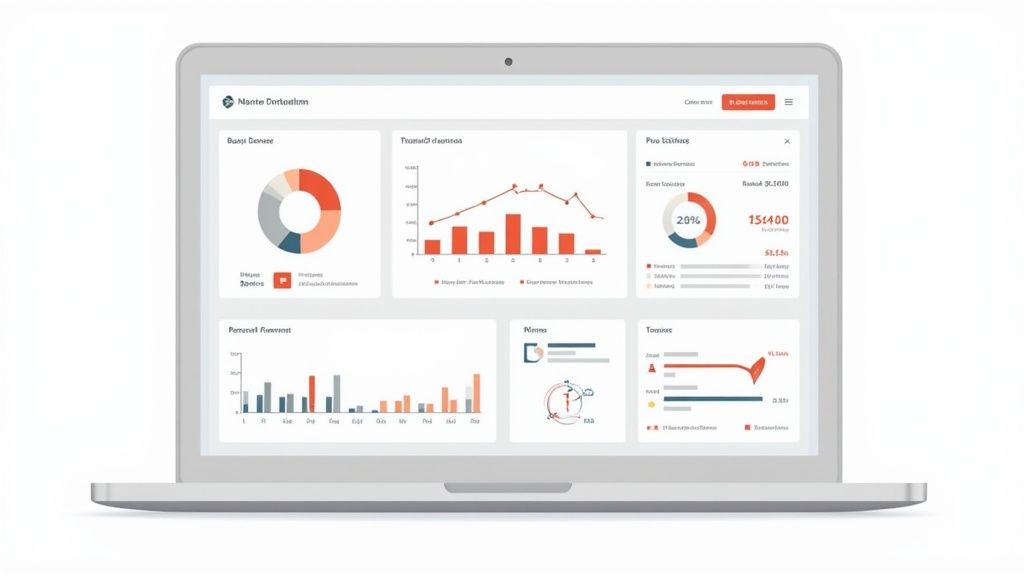
This snapshot gives you a good idea of what a high-level performance overview should look like.
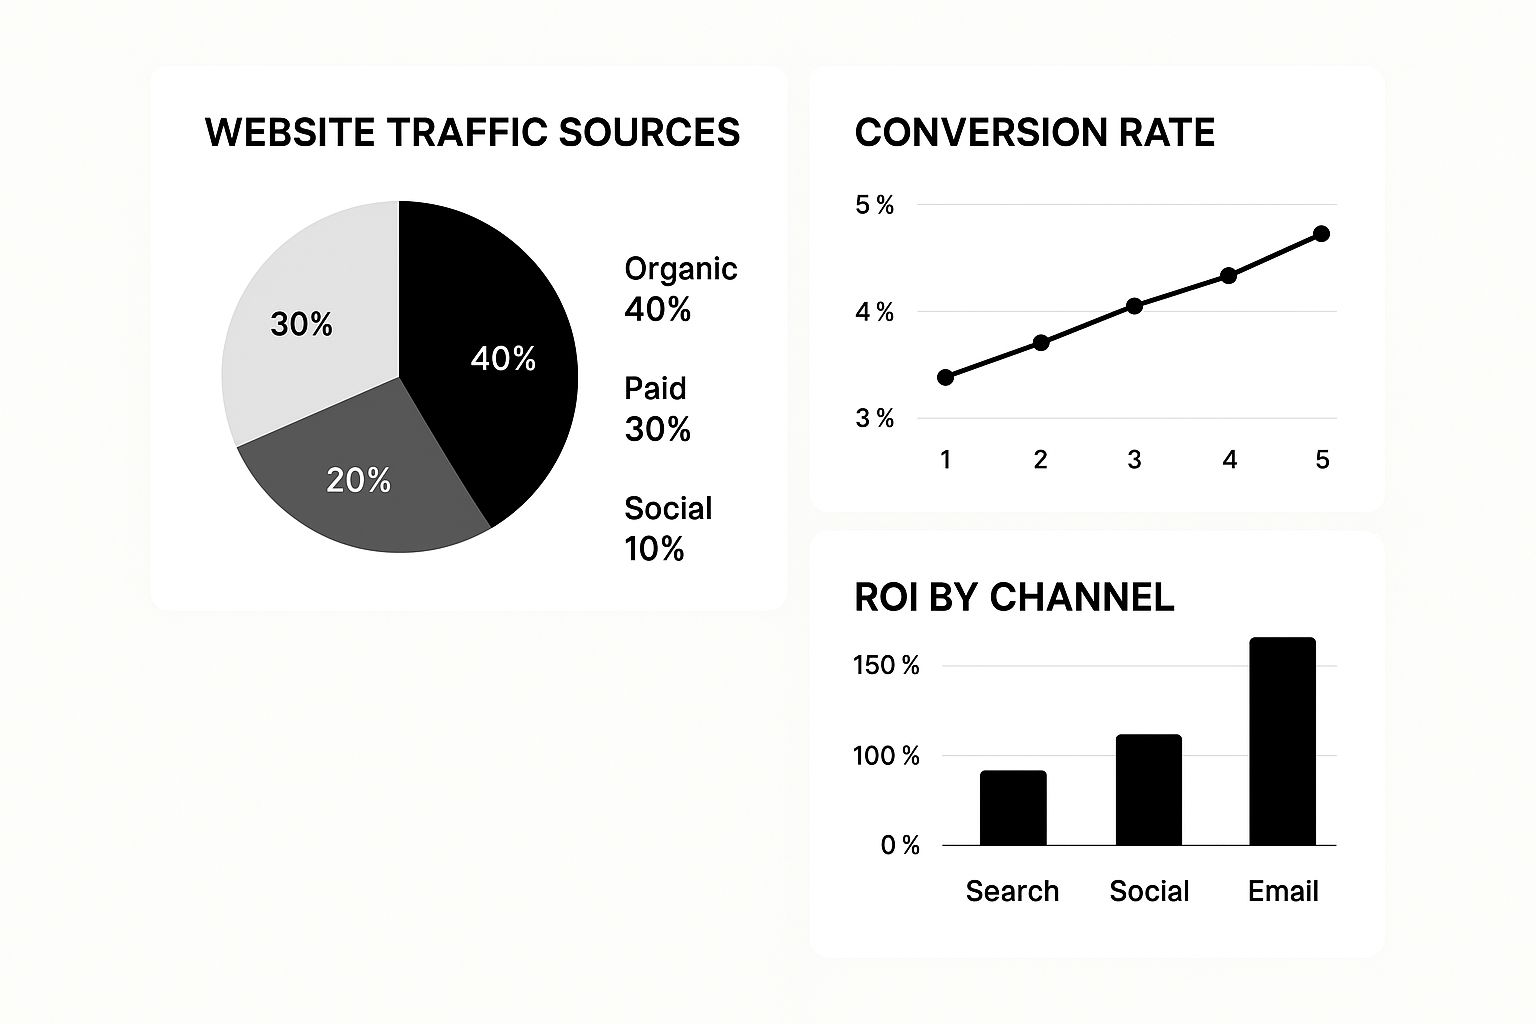
You can see how this visualization immediately clarifies things. In this example, even though organic search brings in the most visitors, email marketing delivers a much higher return on investment—a critical insight when deciding where your next marketing dollar should go.
Distinguishing between what feels good and what actually grows your business is crucial. This table breaks down common pitfalls.
Vanity Metrics vs. Actionable Local KPIs
| Metric Category | Common Vanity Metric (Avoid Over-relying On) | Actionable Local KPI (Focus On This) |
|---|---|---|
| Website Traffic | Total Website Visitors | Visitors from Your Service Area |
| Social Media | Page Likes or Follower Count | Engagement Rate on Localized Posts |
| Search Presence | Total Keyword Rankings (Nationally) | "Money Keyword" Rankings in Monterey/Santa Cruz |
| Engagement | Time on Site (can be misleading) | Form Submissions (Quote Requests) |
Focusing on the "Actionable" column ensures your efforts are tied directly to local business outcomes, not just impressive-sounding numbers.
Engagement and Conversion Metrics: From Clicks to Customers
So, people are finding you. Great. But what happens next? The bridge between that initial awareness and actual revenue is built with engagement and conversion metrics. These numbers tell you if people are just looking or if they're ready to take action.
Chasing website traffic is a classic mistake. As any good SEO agency in Salinas will tell you, it's far more important to track the quality of that traffic. Are visitors engaging, or are they just bouncing away?
Here are the engagement and conversion metrics that truly matter for a local business:
- Click-Through Rate (CTR): What percentage of people who saw your ad or search listing actually clicked it? A strong CTR means your message is hitting the mark with your local audience. It's a sign of a healthy campaign.
- Conversion Rate: This is the big one. What percentage of visitors filled out your quote request form or picked up the phone? This is one of the most direct indicators of your marketing's effectiveness.
- Cost Per Lead (CPL): Simple math, but so important. How much are you spending to get one qualified lead? Tracking your CPL helps you see just how efficient your ad campaigns are. A low CPL means you're getting more bang for your buck.
- Phone Calls from Ads & GBP: For most service-based businesses, the ultimate conversion is a ringing phone. You must use call tracking to see which ads, keywords, or listings are making that happen.
By focusing on these specific, geo-targeted KPIs, your dashboard stops being a confusing page of numbers and starts telling a clear story. It tells you exactly how your marketing is attracting and converting customers right here in the Monterey Bay.
For more tips on building a strategy around this kind of data, take a look at our digital marketing guide for contractors.
Choosing the Right Tool to Build Your Dashboard
Now that your goals and KPIs are locked in, it's time to pick the tool to build your marketing performance dashboard. Let's be clear: you don't need a wildly expensive or complicated platform. For most local businesses, the best tool is simply one you'll find easy to set up and use consistently.
This is the step where all those scattered data points—from campaigns in Pacific Grove to leads from Seaside—finally come together into one clear picture. The great news is there are fantastic, powerful options no matter your budget.
Did You Know? The Monterey Bay region is a powerhouse of innovation, from its ag-tech roots in Salinas to the marine science leadership in Monterey. According to the Monterey Bay Economic Partnership, our region's economic output tops $43 billion, driven by businesses just like yours. A dashboard helps you compete smarter in this dynamic market.
Free vs. Paid Dashboard Tools
For businesses here in Monterey County, the decision usually boils down to a few excellent platforms. Each has its own pros and cons, especially regarding cost, ease of use, and integration capabilities.
Google Looker Studio (Free)
This is our go-to recommendation for most local businesses getting started with dashboards. Because it's a Google product, it plays incredibly well with Google Analytics, Google Ads, and your Google Business Profile.
- The Good: It’s completely free, you can customize it endlessly, and it’s the perfect way to see all your Google-related data in one spot.
- The Catch: There's a learning curve. To pull in data from non-Google sources, like Facebook or Instagram Ads, you'll need third-party connectors, which often have a monthly fee.
Paid Platforms (like Databox or DashThis)
These tools are built from the ground up to be user-friendly. They come packed with pre-built templates and ready-to-go integrations for dozens of common marketing platforms.
- The Good: They are incredibly simple to set up. You get plug-and-play connections for almost any tool you can think of—social media, email marketing, your CRM, you name it.
- The Catch: They come with a monthly subscription. The cost can be modest but can grow depending on how many data sources and dashboards you need.
If your business runs ads on both Google and Facebook, a paid tool might be a worthwhile investment for the convenience of seeing everything together effortlessly. But if 90% of your marketing is focused on local SEO and Google Ads, Looker Studio is more than powerful enough.
Hooking Up Your Data Sources
No matter which tool you land on, the next part is straightforward: connecting your accounts. You’ll simply grant the dashboard platform permission to access your data by logging into each source, like your Google Ads or Facebook Ads account.
This step is what makes the whole thing work. It’s how you can track the performance of your different channels side-by-side. For example, connecting your ad platforms lets you compare the cost-per-lead from search campaigns directly against social media ads.
To get the most out of your ad spend, you need to know which channel gives you the best bang for your buck. We dive much deeper into this in our guide to pay-per-click advertising for home services.
Picking your tool is the last big technical step. Once it's done, you're ready to start seeing your data come to life and making smarter marketing decisions for your Monterey Bay business.
How to Analyze Your Data and Improve ROI
A dashboard is only as good as the decisions it inspires. Staring at numbers won't get you anywhere; you have to learn to read the story they're telling. Let's walk through how to actually analyze your marketing performance dashboard to uncover insights that will grow your business.
A beautiful dashboard full of charts means nothing if it doesn't lead to smarter choices. The real magic happens when you get into a regular rhythm of reviewing your data and, more importantly, asking the right questions. This is how you turn a report into a strategic weapon.
From Data Points to Actionable Insights
Let's get practical. Say you see a huge spike in website traffic. Your first instinct might be to celebrate, but the real work is just beginning. Your dashboard is the tool you'll use to dig in and understand why it happened.
For example, did that traffic come from the new ad campaign you're running for homeowners in Santa Cruz? Or was it an email you sent last Tuesday that hit home with past clients? The goal is to pinpoint what caused the change so you can either do more of it or fix what's broken.
Here’s a simple rhythm that works wonders for our clients:
- The Weekly Check-in (The "What"): This is your quick, 15-minute pulse check. You’re just looking for big changes. Did leads from your Salinas-focused ads suddenly tank? Did your website’s bounce rate skyrocket? It’s about catching problems before they grow.
- The Monthly Review (The "Why"): This is where you do a deeper dive. Compare this month's numbers to last month's, and just as importantly, to the same month last year. This is how you spot bigger trends and ask strategic questions about your efforts in places like San Benito County.
Asking the Right Questions
Your analysis should always be fueled by curiosity. When you look at your dashboard, ask questions that lead to a concrete next step. This is how you connect your marketing to real-world results and see a better return on your investment (ROI).
A dashboard should make you ask "So what?" about every metric. If your Cost Per Click went down, so what? Does that mean you’re getting more leads for the same money, or are those clicks lower quality? Always connect the data back to your bottom line.
This whole process can feel like a lot. In fact, 56% of marketers feel they don’t have enough time to analyze their data. This is precisely why a well-organized dashboard is so critical—it helps you cut through the noise.
Turning Insights Into Budget Decisions
This is where the rubber meets the road. Your analysis should directly inform how you spend your marketing dollars. By consistently reviewing what’s working, you can confidently make moves like these:
- Shifting Your Budget: Move more ad spend into the campaigns that bring in the highest-quality leads for the lowest cost. It's that simple.
- Optimizing the Duds: If an ad is a flop, your data can show you why. Maybe the landing page is confusing, or the ad copy isn't connecting with people.
- Doubling Down on Winners: Discovered that your blog posts are a huge source of booked jobs? It might be time to invest more in creating that kind of content.
This continuous loop—analyze, question, act—is what separates businesses that grow from ones that just tread water. It ensures every dollar you spend on marketing across the Monterey Bay Area is working as hard as possible. To go deeper, explore the ways marketing analytics and reporting impact your campaign success in our detailed guide.
Your Top Marketing Dashboard Questions, Answered
Once you start using your new marketing performance dashboard, you're going to have questions. That's normal. It’s a shift from running on gut feelings to making data-backed decisions, and it takes time to get the hang of it.
Here are some of the most common questions I get from business owners across the Monterey Bay Area.
How often should I look at this thing?
This is probably the number one question. It's easy to get obsessed and check it every hour, but that's not productive.
For most businesses, a quick weekly check-in is the sweet spot. This frequency helps you catch any big, sudden shifts—like a key ad suddenly tanking—without getting bogged down by the tiny ups and downs of daily data. You're looking for trends, not noise.
Then, block out time for a deeper dive once a month. This is where you zoom out. Compare your performance this month to last month, and even more importantly, to the same month last year. This is how you'll understand your growth and plan your budget for the next month here in Santa Cruz County.
With all these numbers, what’s the most important one?
It’s tempting to get excited about big traffic numbers, but honestly, that's often a vanity metric. What really matters are the metrics closest to making your phone ring and putting money in the bank. We call these conversions.
Chasing website traffic is easy, but it won't pay the bills. The real gold is in the metrics that represent a customer taking a significant step, like picking up the phone or asking for a quote.
For a local business here in Monterey, that almost always boils down to a few key things:
- Phone Calls from your ads and your Google Business Profile.
- Contact Form Submissions from people asking for a quote.
- Booked Appointments made directly through your website's scheduling tool.
Focusing on these actions gives you the cleanest, most direct line to calculating your real return on investment (ROI). Everything else is just supporting data.
Can I see which towns are my best spots?
Yes, and you absolutely should be. This is one of the most powerful features of a properly set up dashboard. Seeing your performance broken down geographically is a game-changer. Almost half of all Google searches have local intent, so if you're not tracking what's happening at the local level, you're flying blind. You can see more stats on this in this digital marketing statistics roundup.
Your dashboard can pinpoint which zip codes or cities send you the most valuable leads. You might see that your ads in Salinas are converting twice as well as your ads elsewhere. An insight like that is pure gold. It tells a smart SEO agency in Salinas exactly where to double down on your ad spend, making every dollar work harder for you.
Ready to stop guessing and start making data-driven decisions that grow your business? The team at Core6 Marketing builds custom marketing performance dashboards that give you the clarity you need.
Schedule your free, no-obligation consultation today!
By Phil Fisk, CEO, Core6 Marketing
Phil Fisk is the founder and CEO of Core6 Marketing, a digital marketing agency based in Salinas, CA, that specializes in helping home service contractors and local businesses grow. With over a decade of experience, Phil is passionate about using data and technology to deliver measurable results for businesses in the Monterey Bay Area.
Core6 Marketing
1628 N. Main St #263, Salinas, CA 93906
831-789-9320
[email protected]
https://core6.marketing/
Suggested Social Caption: Stop guessing about your marketing ROI. A marketing performance dashboard gives you the clarity to grow your Monterey Bay business. Here's how to build one. #MontereyBay #MarketingDashboard #SmallBizTips